Usage Reports
The Usage Reports area of your dashboard allows you to easily track how often you use each ZeroBounce tool or service. Tracking includes data from the members’ dashboard, listed as the graphical user interface (GUI), as well as the API.
Usage Reports currently tracks details for the following services:
- Email Validation
- Email Scoring
- Email Finder
- Activity Data
- Inbox Placement Test
- Email Server Test
Reading your Total Usage Report
At the top of the Usage Reports section, you’ll find a graph titled “Total Usage.” This graph automatically shows your service usage for the previous month, with today being the most recent date.
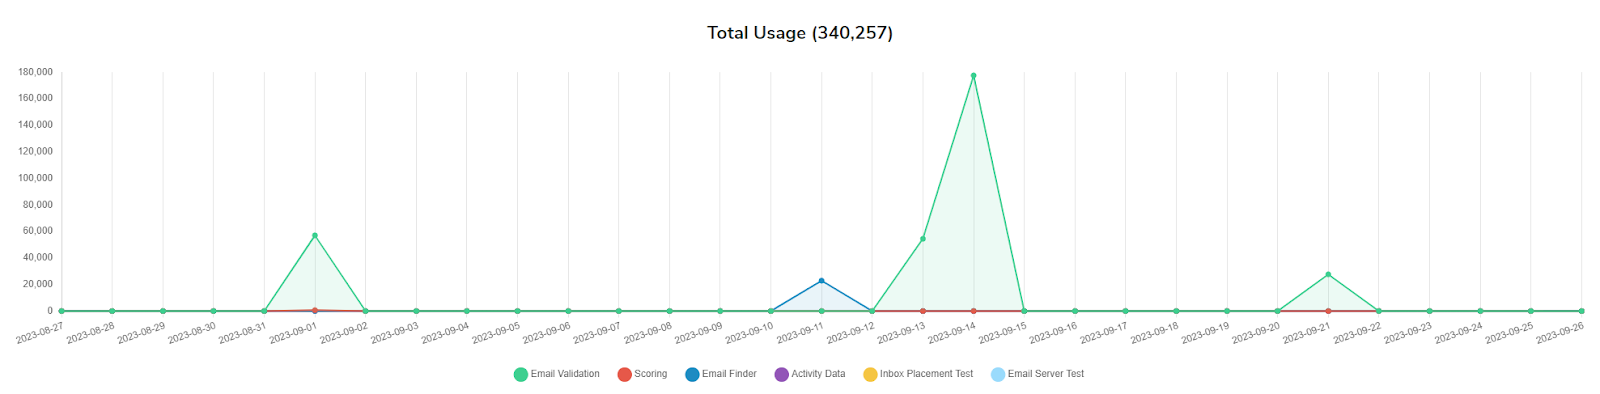
The Total Usage graph charts your total service usage for a predefined period
The y-axis represents the number of records created by a service.
The x-axis represents the date that the records were created.
Each ZeroBounce service is color-coded and reflected accordingly on the graph. The color coding is as follows:
- Email Validation (represented by green )
- Email Scoring (represented by red )
- Email Finder (represented by dark blue )
- Activity Data (represented by purple )
- Inbox Placement Test (represented by yellow )
- Email Server Test (represented by light blue )
You can hover your cursor over a specific date or point on the map to see your exact usage numbers.
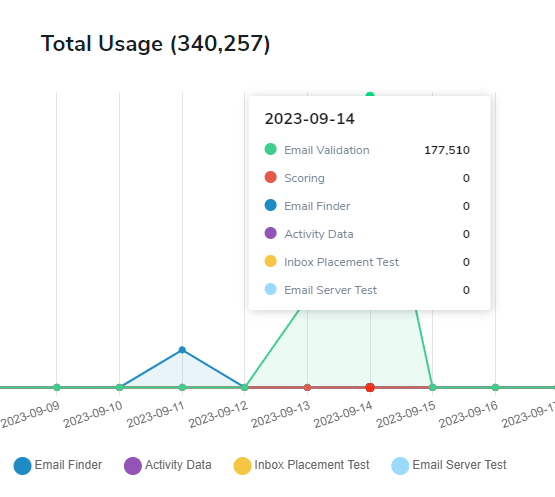
You can find specific usage reports by selecting a graph point or date and hovering your cursor over it
Finally, you can see your total usage records for all services in parentheses next to “Total Usage” at the top of the graph.
Reading your Total Usage Report
You can update the date range for your Usage Reports with the date selector at the top of the page
First, you can freely toggle between the default daily view and a monthly overview.
To select a specific date range, use the date selector in the top-left corner of the graph.
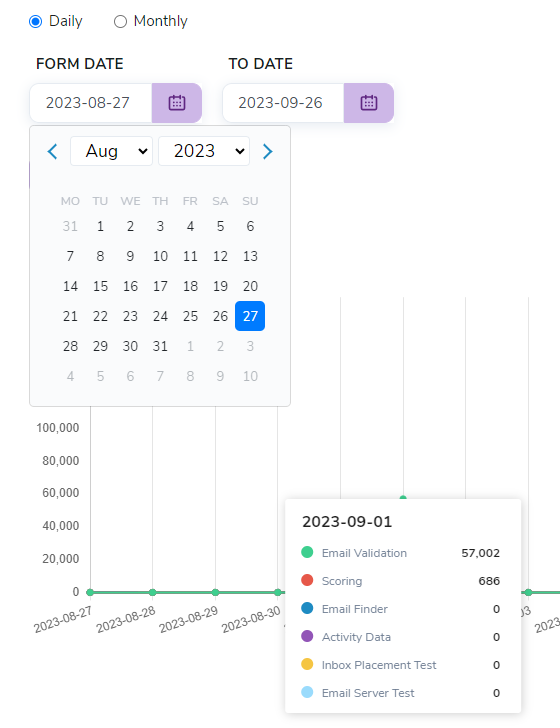
To update your reporting dates, select a “from” and “to” date using the calendar widget
After selecting your reporting dates, click the “Generate Report” button. All sections of your Usage Reports will be updated accordingly. This change is reflected through Total Usage, Summary, and Usage Details reports.
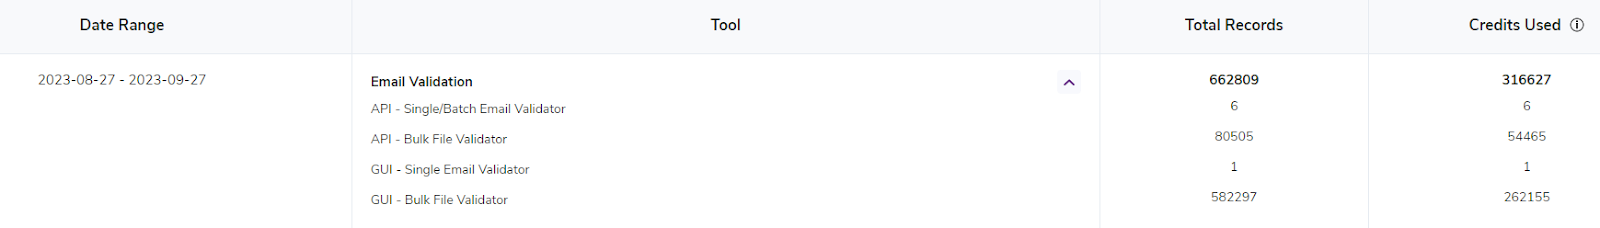
Reading your Summary Report
The Summary Report lists each ZeroBounce email service and the total usage and number of credits used.
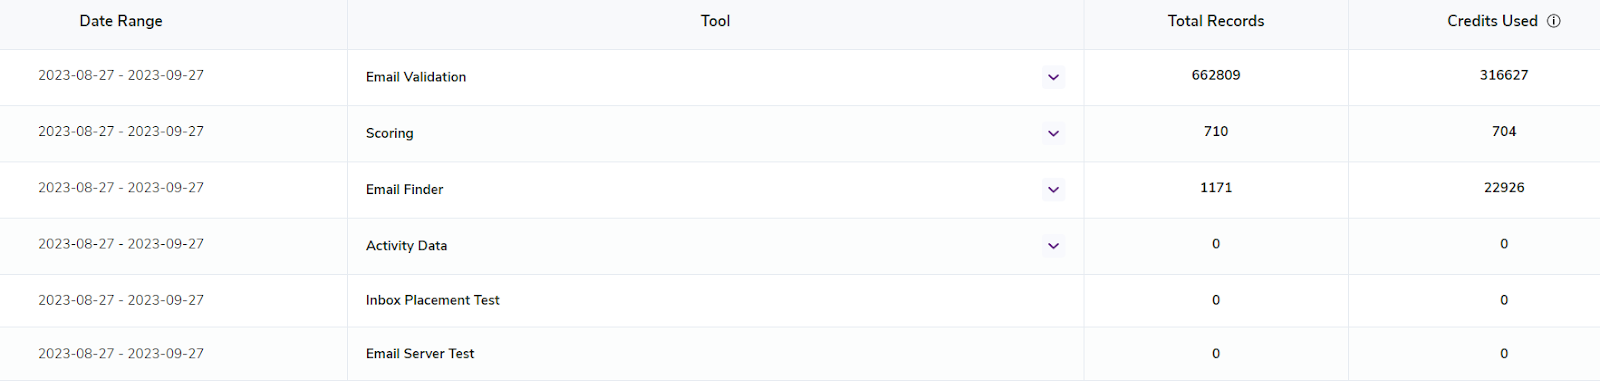
An average Summary report in your ZeroBounce Usage Reports
This report is a basic table with easy-to-understand columns.
- Date Range - shows the reporting dates selected at the top of the page
- Tool - describes the analyzed email service
- Total Records - the total number of records created when using the service
- Credits Used - the number of ZeroBounce credits used to create records
API vs. GUI usage reports
Four services contain additional information via dropdown menus: email validation, Scoring, Email Finder, and Activity Data. The dropdowns further break down the total usage based on how customers use the tool.
After using one of the dropdowns, you’ll see a description of the service along with total records and credits used in non-bold font.
Click the dropdown next to an email service to get reports on API vs. GUI usage
ZeroBounce creates email validation usage reports for the following:
- API - Single/Batch Email Validator endpoints
- API - Bulk File Validator endpoint
- GUI (your dashboard) - Single Email Validator
- GUI - Bulk File Validator
For Scoring, the following usage reports are available:
- API - Bulk File Scoring
- GUI - Bulk File Scoring
For Email Finder, the following usage reports are available:
- GUI - Bulk Email Finder (queries)
- GUI - Bulk Email Finder (credits)
- GUI - Bulk Domain Search (queries)
- GUI - Bulk Domain Search (credits)
Be aware that in addition to separating domain search and email finder, queries and credit usage are also tallied separately. This is useful for analyzing how many queries you use from your current subscription plan (if you have one) and how many additional credits you use for your searches.
For Activity Data, the following usage reports are available:
- GUI - File Download Append Activity Data
Reading your Usage Details
The final section of Usage Reports contains your Usage Details.
This standard spreadsheet lists each email service along with each date in your selected reporting period. Find where each service intersects with a specific date to determine how many records were created on that date.
You can click the text on dates when records were created to get a more detailed rundown of your usage.
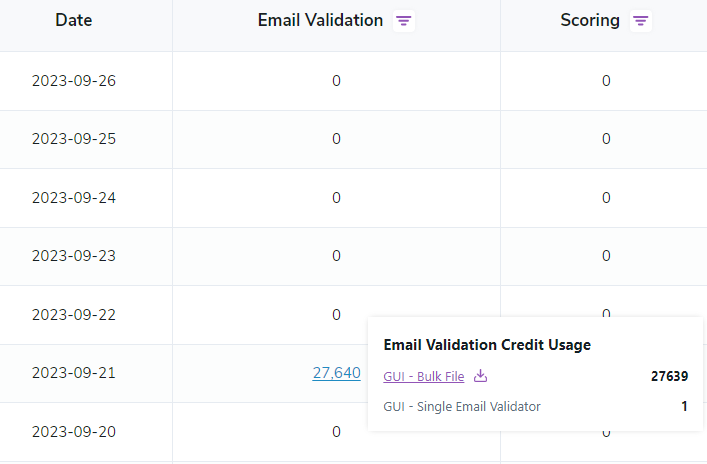
Click any hyperlink in your Usage Details to get a breakdown of your credit or query usage
If you wish to update your Usage Details to show data on specific endpoints, click the icon next to the service at the top of the table. Then, check the boxes next to the services you want to see reflected in the table.
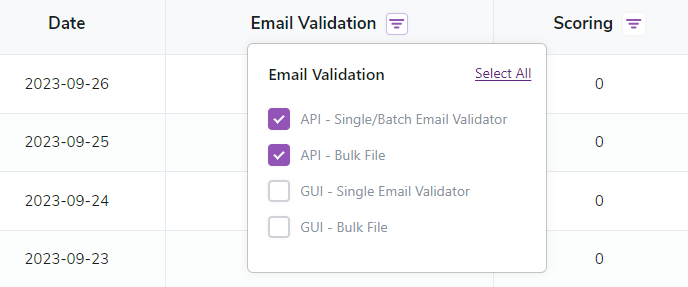
To customize your Usage Details, click the icon next to the service. Then, check the boxes you want to see in your reporting sheet.
Downloading your Usage Reports
You can download both Summary Reports and Usage details for your records.
To do so, go to the section that contains the report you wish to download. You'll see a download link in the top-right corner of that section. Click this link to download your report as a CSV file.
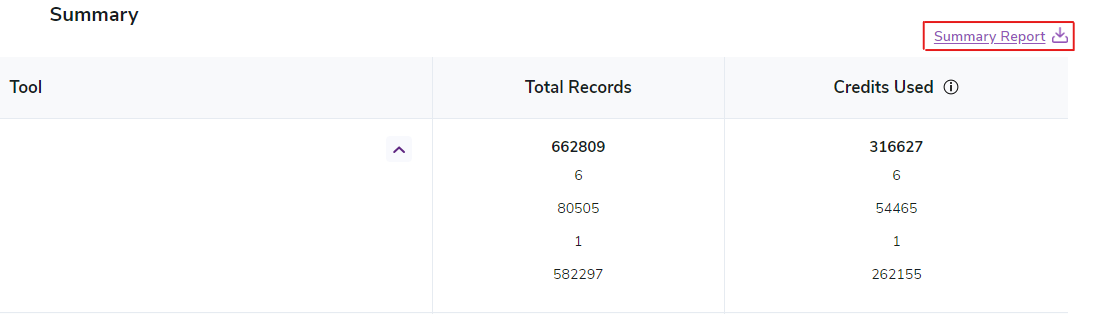
Go to either Summary Report or Usage Details, and click the link to download your report